Marketview Results for March Quarter
Consumer spending results for the March Quarter from BNZ Marketview are now in.
Results summary:
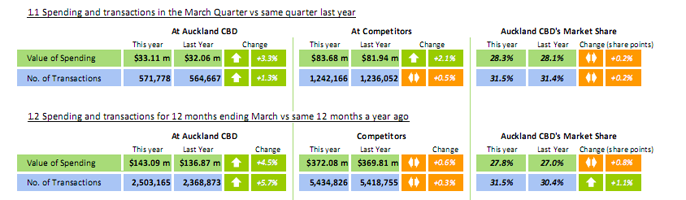
In a relatively flat market, Heart of the City businesses are performing well compared to other retail areas. Spending for HOTCity remained steady with an increase of 3.3% compared to an increase of only 2.1% for other comparable retail areas.
Year on Year results for the year ending March saw an increase in spending of 4.5% for HOTCity and a 0.6% increase for other retail areas over the 12 month period.
Retail category performance:
For the March Quarter, retail categories that performed particularly well in HOTCity were Apparel (+19.7%, compared to +5.2% in other areas), Bars, Cafes and Restaurants (+9.2%, compared to +1.0% in other areas and far above the national average), Department Stores (+7.7% compared to +5.9% in other areas) and Furniture, Houseware and Appliance Retailing (+7.8% compared to +4.9% in other areas).
For the March Quarter, retail categories that performed particularly well in HOTCity were Apparel (+19.7%, compared to +5.2% in other areas), Bars, Cafes and Restaurants (+9.2%, compared to +1.0% in other areas and far above the national average), Department Stores (+7.7% compared to +5.9% in other areas) and Furniture, Houseware and Appliance Retailing (+7.8% compared to +4.9% in other areas).
HOTC precinct performance*:
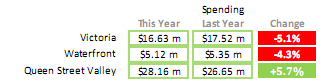
The difference in spend for the March quarter, compared to the same period last year, for CBD precincts is as follows:
The difference in spend for the March quarter, compared to the same period last year, for CBD precincts is as follows:
Victoria
Quarter: -5.1%
Waterfront:
-4.3%
Queen
Street Valley: +5.7% (including Britomart: +44.2%, Fort Street Area: +4.6%, High Street District: +5.5%, Queen Street: +4.8%, Other Queen Street Valley: -0.7%)
*The
CBD precincts area includes streets in the CBD that sit outside the HOTC
Members Boundary, particularly in the Victoria, Waterfront and Fort Street
Precinct Areas.
Information
Source: BNZ Marketview, Produced by Marketview Limited. Please contact us for
more information.